Note
Click here to download the full example code
D-Flandrin Distribution of a Hyperbolic Group Delay Signal
This example shows the D-Flandrin distribution of a signal having hyperbolic group delay. This is the only type of distribution that almost perfectly localizes signals having a group delay in \(1 / \sqrt{\nu}\)
Figure 4.22 from the tutorial.
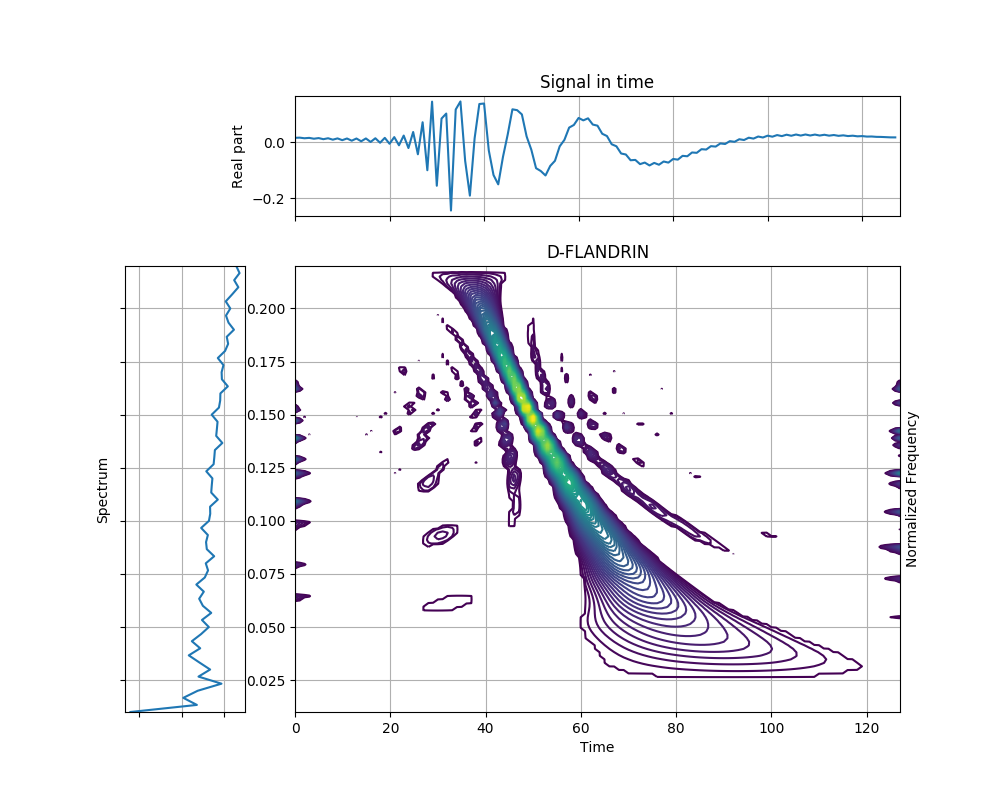
from tftb.processing import DFlandrinDistribution
from tftb.generators import gdpower

sig = gdpower(128, 1.0 / 2)[0]
spec = DFlandrinDistribution(sig, fmin=0.01, fmax=0.22, n_voices=128)
spec.run()
spec.plot()
Total running time of the script: ( 0 minutes 0.747 seconds)