Note
Click here to download the full example code
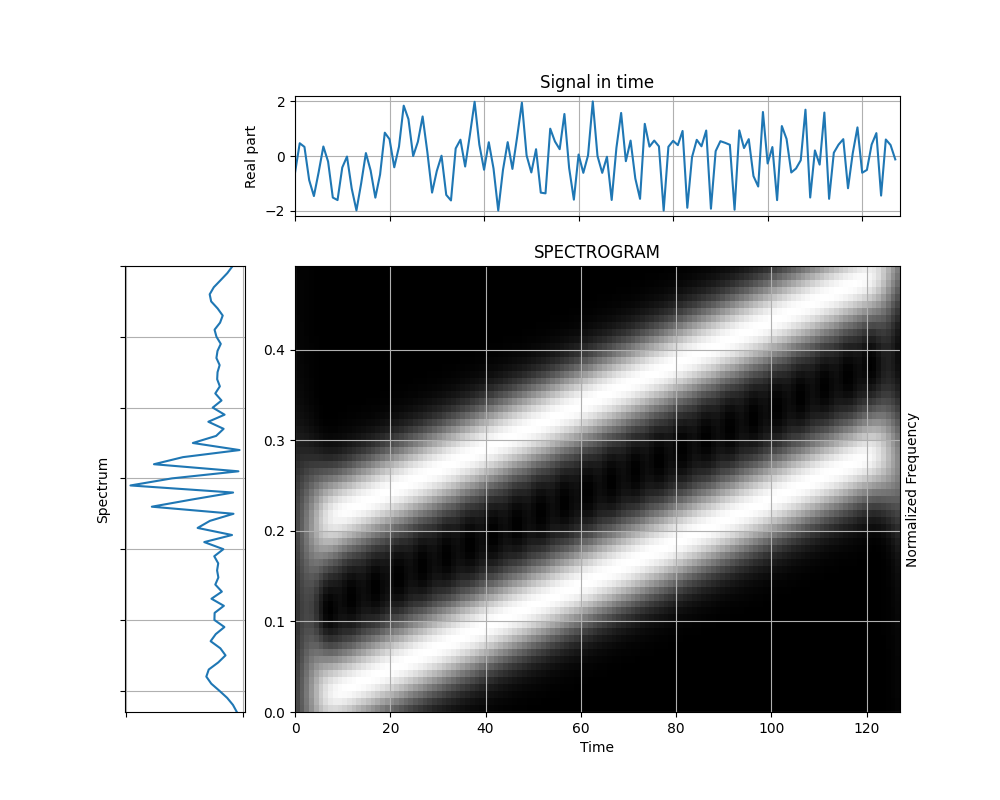
Distant Chirps with a Short Gaussian Analysis Window
Figure 3.17 from the tutorial.
from tftb.generators import fmlin
from tftb.processing.cohen import Spectrogram
import numpy as np
import matplotlib.pyplot as plt

sig = fmlin(128, 0, 0.3)[0] + fmlin(128, 0.2, 0.5)[0]
window = np.exp(np.log(0.005) * np.linspace(-1, 1, 23) ** 2)
spec = Spectrogram(sig, fwindow=window, n_fbins=128)
spec.run()
spec.plot(show_tf=True, cmap=plt.cm.gray)
Total running time of the script: ( 0 minutes 0.256 seconds)