Note
Click here to download the full example code
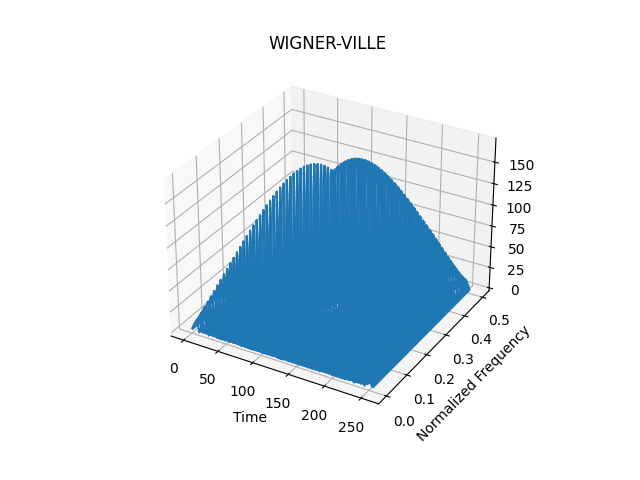
Wigner-Ville distribution of a Chirp
This example shows the wireframe plot of the Wigner-Ville distribution of a chirp. The WV distribution can take negative values, and has almost perfect localization in the time-frequency plane.
Figure 4.1 from the tutorial.
from tftb.generators import fmlin
from tftb.processing import WignerVilleDistribution

sig = fmlin(256)[0]
tfr = WignerVilleDistribution(sig)
tfr.run()
tfr.plot(threshold=0.0, kind='wireframe')
Total running time of the script: ( 0 minutes 0.289 seconds)