Note
Click here to download the full example code
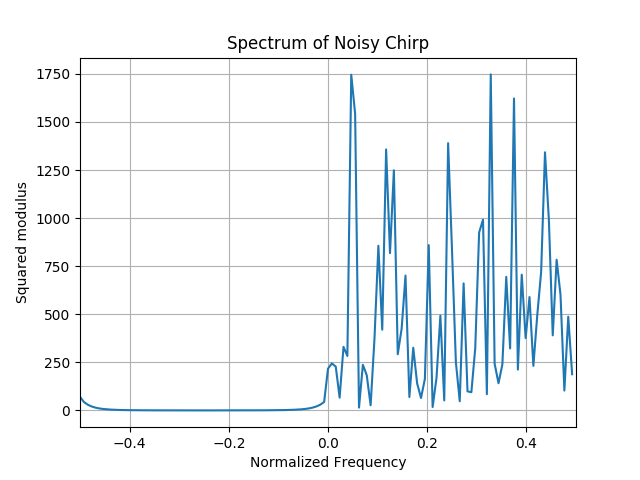
Energy Spectrum of a Noisy Chirp
Generate a noisy chirp and plot its energy spectrum.
Figure 1.5 from the tutorial.
from tftb.generators import fmlin, sigmerge, noisecg
import matplotlib.pyplot as plt
import numpy as np

# Generate a chirp signal

n_points = 128
fmin, fmax = 0.0, 0.5

signal, _ = fmlin(n_points, fmin, fmax)

# Noisy chirp

noisy_signal = sigmerge(signal, noisecg(128), 0)

# Enery spectrum of the noisy chirp.

dsp1 = np.fft.fftshift(np.abs(np.fft.fft(noisy_signal)) ** 2)
plt.plot(np.arange(-64, 64, dtype=float) / 128.0, dsp1)
plt.xlim(-0.5, 0.5)
plt.title('Spectrum of Noisy Chirp')
plt.ylabel('Squared modulus')
plt.xlabel('Normalized Frequency')
plt.grid()
plt.show()
Total running time of the script: ( 0 minutes 0.164 seconds)