Note
Click here to download the full example code
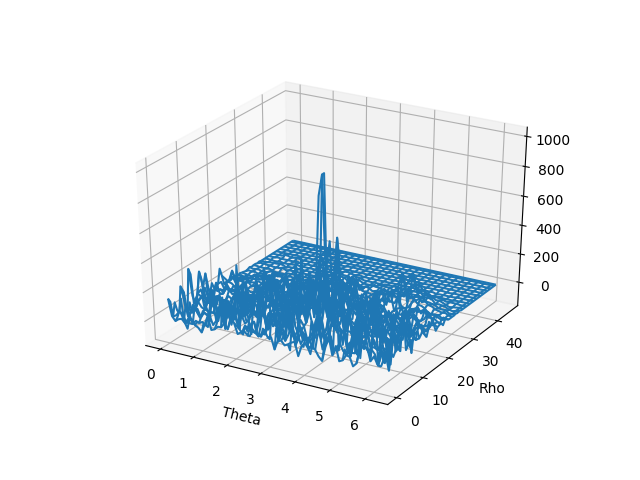
Wigner-Hough Transform of a Chirp
This example demonstrates the use of the Hough transform to extract the estimates of a chirp signal from its Wigner Ville distribution.
Figure 5.4 from the tutorial.
import numpy as np
from tftb.generators import noisecg, sigmerge, fmlin
from tftb.processing.cohen import WignerVilleDistribution
from tftb.processing.postprocessing import hough_transform
import matplotlib.pyplot as plt
from mpl_toolkits.mplot3d import Axes3D

N = 64
sig = sigmerge(fmlin(N, 0, 0.3)[0], noisecg(N), 1)
tfr, _, _ = WignerVilleDistribution(sig).run()

ht, rho, theta = hough_transform(tfr, N, N)
theta, rho = np.meshgrid(theta, rho)
fig = plt.figure()
ax = fig.gca(projection='3d')
ax.plot_wireframe(theta, rho, ht)
ax.set_xlabel('Theta')
ax.set_ylabel('Rho')
plt.show()
Total running time of the script: ( 0 minutes 2.303 seconds)