Note
Click here to download the full example code
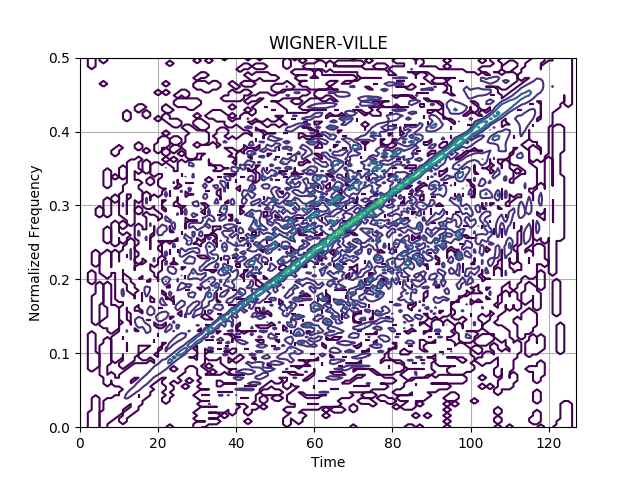
Wigner-Ville Distribution of a Noisy Chirp
Generate a noisy chirp and visualize its Wigner-Ville spectrum.
Figure 1.6 from the tutorial.
from tftb.generators import fmlin, sigmerge, noisecg
from tftb.processing.cohen import WignerVilleDistribution

# Generate a chirp signal

n_points = 128
fmin, fmax = 0.0, 0.5

signal, _ = fmlin(n_points, fmin, fmax)

# Noisy chirp

noisy_signal = sigmerge(signal, noisecg(128), 0)


# Wigner-Ville spectrum of noisy chirp.

wvd = WignerVilleDistribution(noisy_signal)
wvd.run()
wvd.plot(kind='contour')
Total running time of the script: ( 0 minutes 0.270 seconds)