Note
Click here to download the full example code
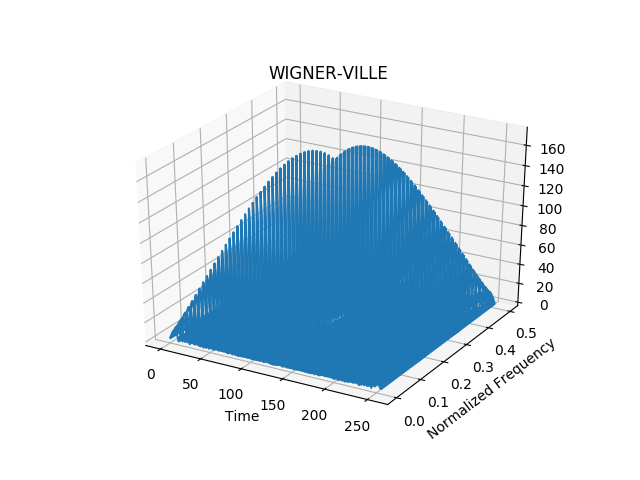
Wigner-Ville distribution of a Chirp
This example shows the wireframe plot of the Wigner-Ville distribution of a chirp. The WV distribution can take negative values, and has almost perfect localization in the time-frequency plane.
Figure 4.1 from the tutorial.
Out:
/home/docs/checkouts/readthedocs.org/user_builds/tftb/envs/latest/lib/python3.7/site-packages/tftb/processing/base.py:219: UserWarning: Requested projection is different from current axis projection, creating new axis with requested projection.
  ax = fig.gca(projection="3d")
/home/docs/checkouts/readthedocs.org/user_builds/tftb/envs/latest/lib/python3.7/site-packages/tftb/processing/base.py:219: MatplotlibDeprecationWarning: Adding an axes using the same arguments as a previous axes currently reuses the earlier instance.  In a future version, a new instance will always be created and returned.  Meanwhile, this warning can be suppressed, and the future behavior ensured, by passing a unique label to each axes instance.
  ax = fig.gca(projection="3d")
from tftb.generators import fmlin
from tftb.processing import WignerVilleDistribution

sig = fmlin(256)[0]
tfr = WignerVilleDistribution(sig)
tfr.run()
tfr.plot(threshold=0.0, kind='wireframe')
Total running time of the script: ( 0 minutes 0.816 seconds)