Note
Click here to download the full example code
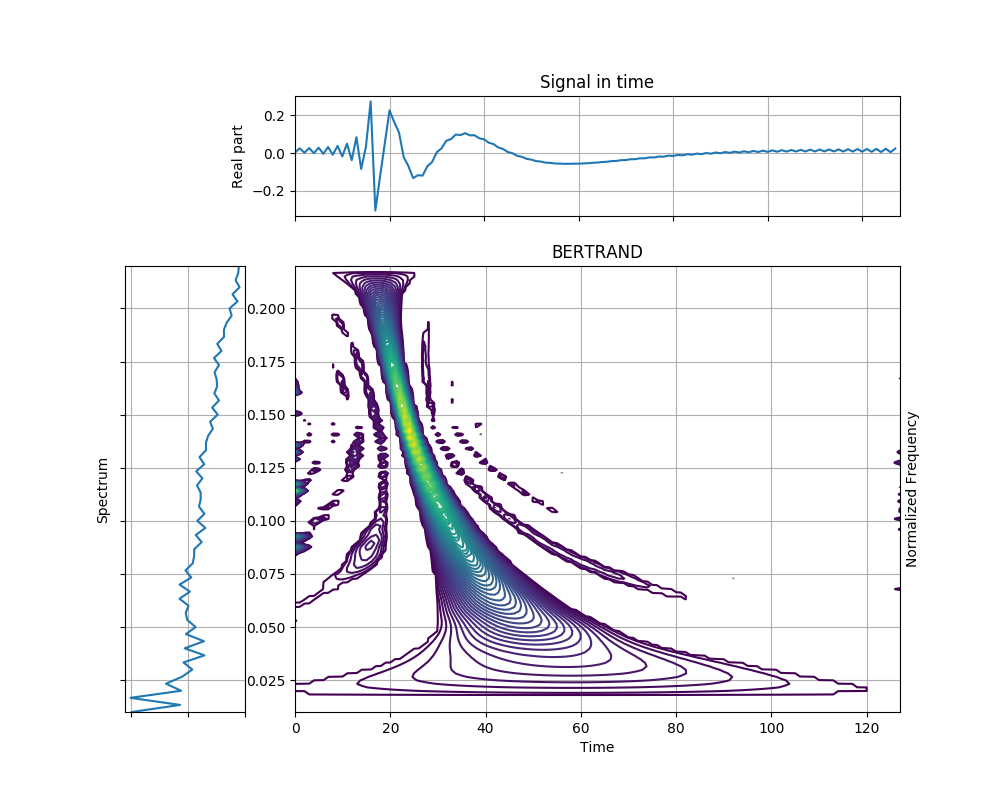
Bertrand Distribution of a Hyperbolic Group Delay Signal
This example shows the Bertrand distribution of a signal with hyperbolic group delay. The distribution is well localized around the hyperbola, but not perfectly. The Bertrand distribution operates only on a part of the frequency range between two bounds \(f_{min}\) and \(f_{max}\).
Figure 4.21 from the tutorial.
from tftb.processing.affine import BertrandDistribution
from tftb.generators import gdpower


sig = gdpower(128)[0]
bert = BertrandDistribution(sig, fmin=0.01, fmax=0.22)
bert.run()
bert.plot()
Total running time of the script: ( 0 minutes 0.967 seconds)