Note
Click here to download the full example code
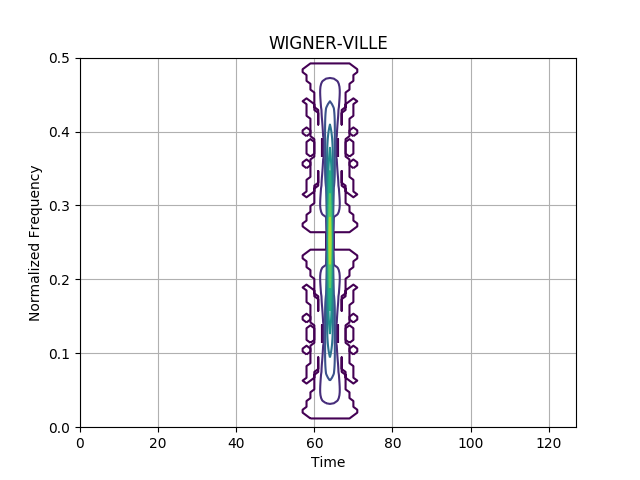
Wigner-Ville Distribution of a Dirac Impulse Function
This example demonstrates the Wigner-Ville distribution of a Dirac impulse function, and shows the limitations of the WV distribution when applied to broadband signals.
Figure 4.24 from the tutorial.
from tftb.generators import anapulse
from tftb.processing import WignerVilleDistribution

sig = anapulse(128)
wvd = WignerVilleDistribution(sig)
wvd.run()
wvd.plot(kind="contour", scale="log")
Total running time of the script: ( 0 minutes 2.262 seconds)