Note
Click here to download the full example code
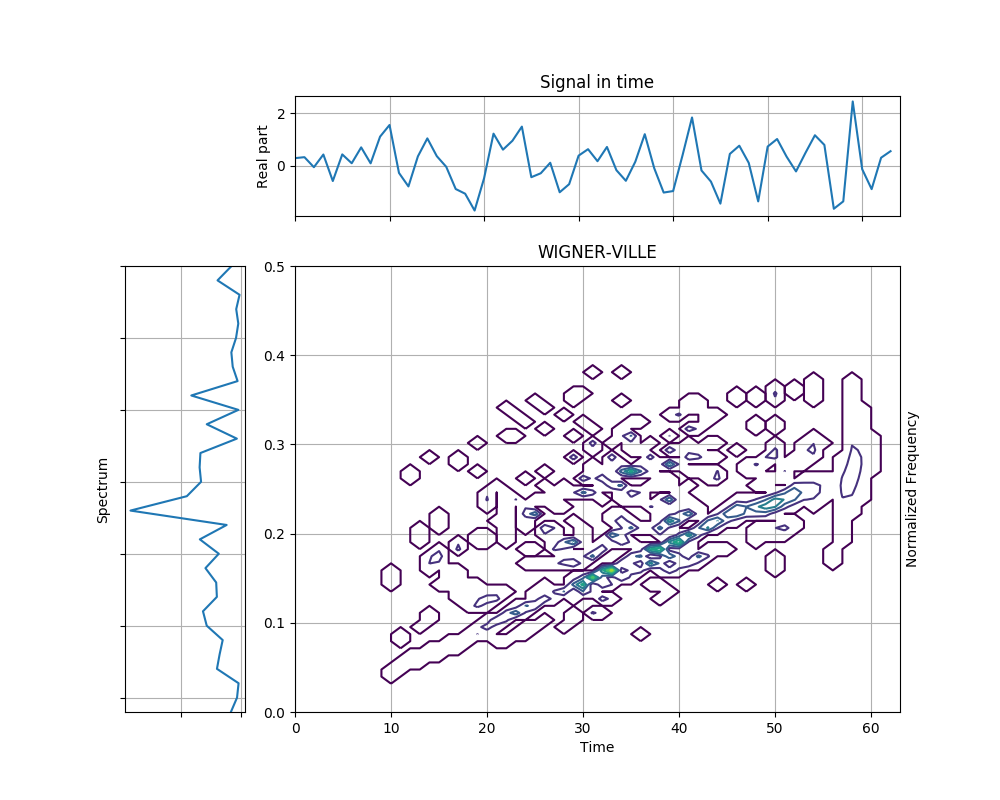
Wigner-Ville Distribution of a Noisy Chirp
This example shows the Wigner-Ville distribution of a noisy chirp signal. The linear frequency increase is undetectable in the time domain, but a straight line can be seen in the distribution.
Figure 5.3 from the tutorial.
from tftb.generators import noisecg, sigmerge, fmlin
from tftb.processing.cohen import WignerVilleDistribution

N = 64
sig = sigmerge(fmlin(N, 0, 0.3)[0], noisecg(N), 1)
wvd = WignerVilleDistribution(sig)
wvd.run()
wvd.plot(kind='contour', show_tf=True, sqmod=True)
Total running time of the script: ( 0 minutes 0.386 seconds)