Note
Click here to download the full example code
Wigner Ville Distribution of Two Simultaneous Chirps
The signal to be analyzed contains two linear frequency modulations, each with a different slope. Note the interference between them.
Figure 5.5 from the tutorial.
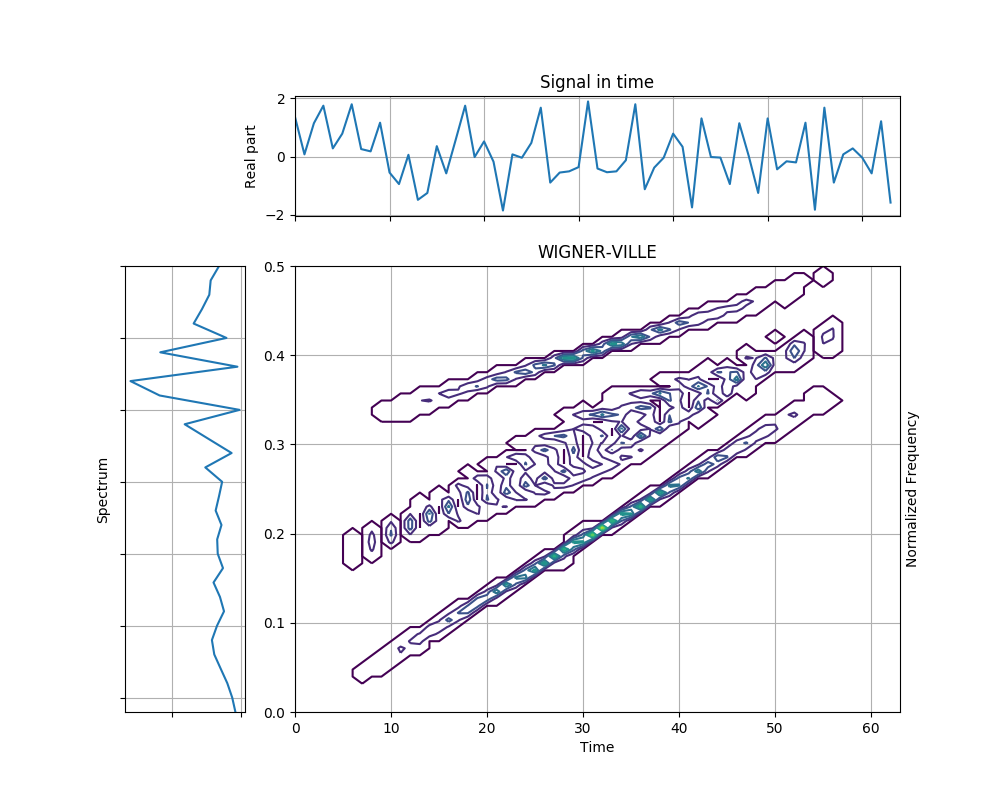
from tftb.generators import fmlin, sigmerge
from tftb.processing.cohen import WignerVilleDistribution

N = 64
sig = sigmerge(fmlin(N, 0, 0.4)[0], fmlin(N, 0.3, 0.5)[0], 1)
tfr = WignerVilleDistribution(sig)
tfr.run()
tfr.plot(kind='contour', sqmod=True, show_tf=True)
Total running time of the script: ( 0 minutes 0.388 seconds)