Note
Click here to download the full example code
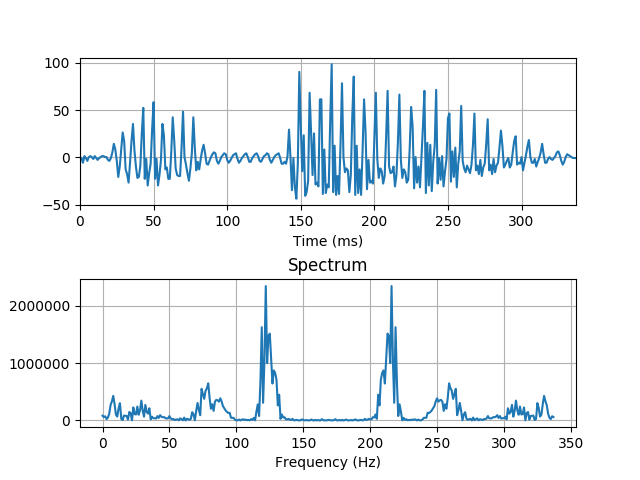
Energy Spectrum of an Audio Signal
Figure 3.3 from the tutorial.
from os.path import dirname, abspath, join
from scipy.io import loadmat
import numpy as np
import matplotlib.pyplot as plt

DATA_PATH = join(abspath(dirname("__file__")), "data", "gabor.mat")
signal = loadmat(DATA_PATH)['gabor'].ravel()
time = np.arange(338)
dsp = np.fft.fftshift(np.abs(np.fft.fft(signal)) ** 2)
freq = np.arange(-169, 169, dtype=float) / 338 * 1000

plt.subplot(211)
plt.plot(time, signal)
plt.grid(True)
plt.xlim(0, time.max())
plt.xlabel('Time (ms)')

plt.subplot(212)
plt.plot(dsp)
plt.grid(True)
plt.title('Spectrum')
plt.xlabel('Frequency (Hz)')

plt.subplots_adjust(hspace=0.5)

plt.show()
Total running time of the script: ( 0 minutes 0.227 seconds)